The Analytics & Logs section of WowShipping gives you a clear overview of how your shipping rules are performing in real orders. It combines visual insights with detailed logs so you can monitor costs, track methods used, and analyze trends over time.
Overview of the Section
When you open Analytics & Logs, you’ll find three major parts:
- Shipping Cost Insights – Displays trends in average shipping costs as numbers and charts.
- Shipping Method Usage (%) – Provides a percentage breakdown of shipping method usage.
- Orders with Shipping Details – A record of individual orders along with their shipping information.
This section highlights how shipping methods influence sales performance, profitability, and customer behavior. Let’s look at each part.
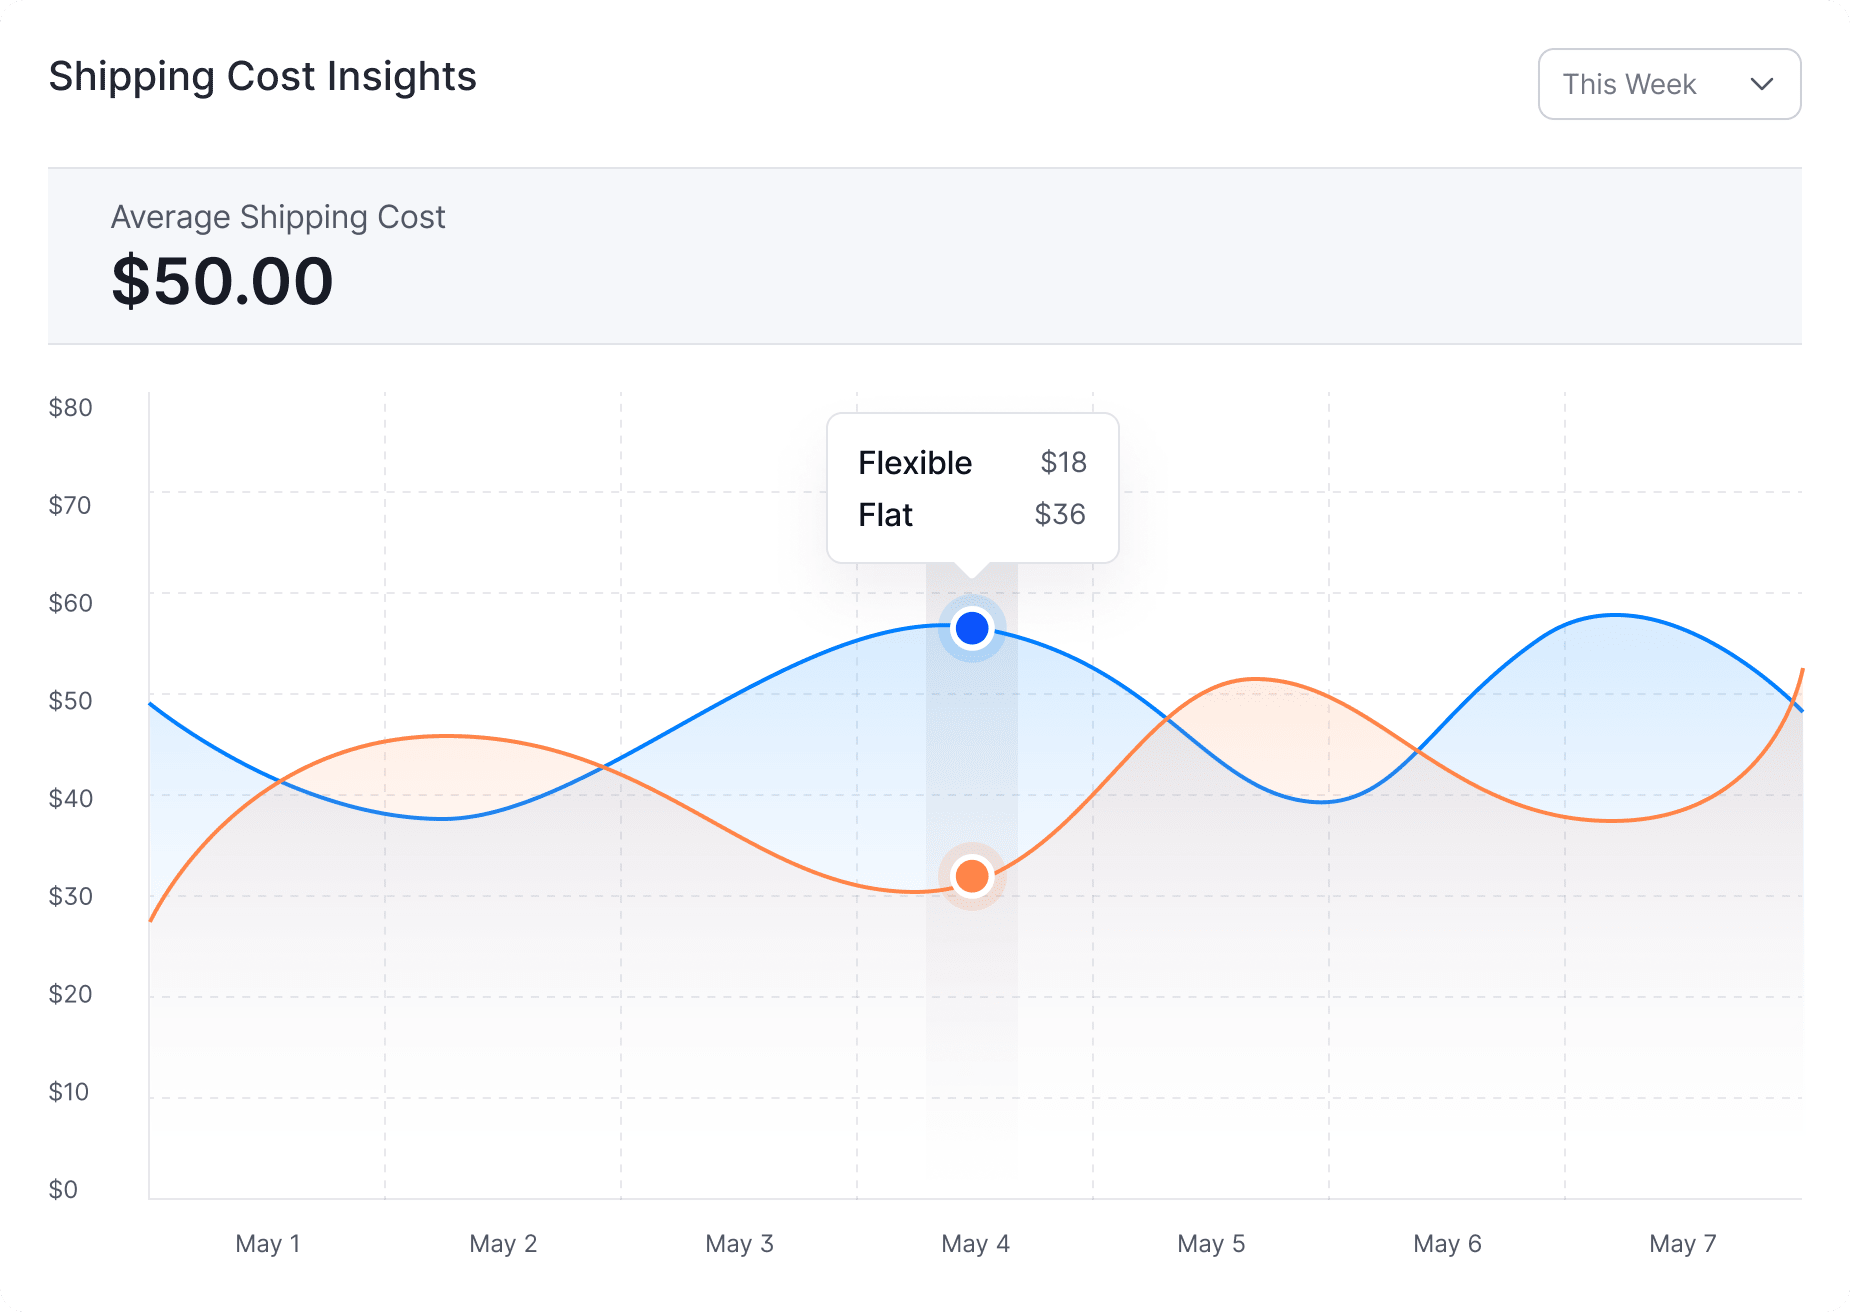
1. Shipping Cost Insights
The Shipping Cost Insights panel displays your store’s average shipping cost for a selected time period. Data appears in both numeric and chart formats, allowing you to:
- Monitor shipping cost trends
- Improve your shipping decisions
- Compare each shipping method’s performance
You can track daily shipping costs to spot patterns or unusual changes. Insights are available for time ranges like This Week, Last 30 Days, and Last 90 Days.
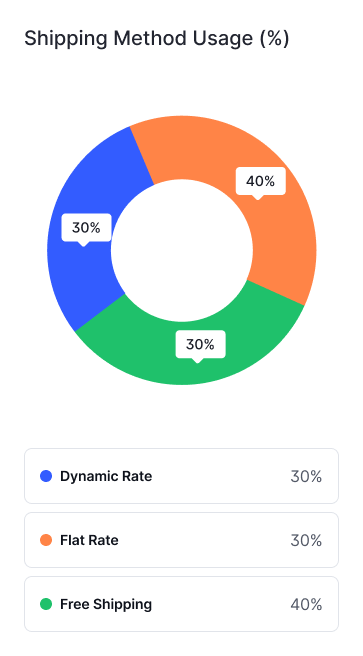
2. Shipping Method Usage (%)
The panel provides a percentage-based breakdown of how frequently each shipping method is used in your store. Instead of raw counts, the data is converted into percentages and displayed in a donut chart for easy interpretation.
This view helps you understand customer preferences, evaluate the performance of your shipping options, and identify areas where adjustments may improve results.
Here are some scenarios:
- Free Shipping: Usage increases from 25 percent to 60 percent in one week. This suggests the promotion performed well, but you may need to review profit margins.
- Dynamic Rate: Shows 0 percent usage over 90 days. This could indicate that the methods are unclear, too restrictive, or priced too high.
- Flat Rate: Used for 70 percent of orders. This suggests it is a reliable choice and may remain a good default option.
- Live Rates: Usage drops after enabling a carrier. This may indicate higher real-time prices or slow rate fetching, so review carrier settings and compare costs with other methods.
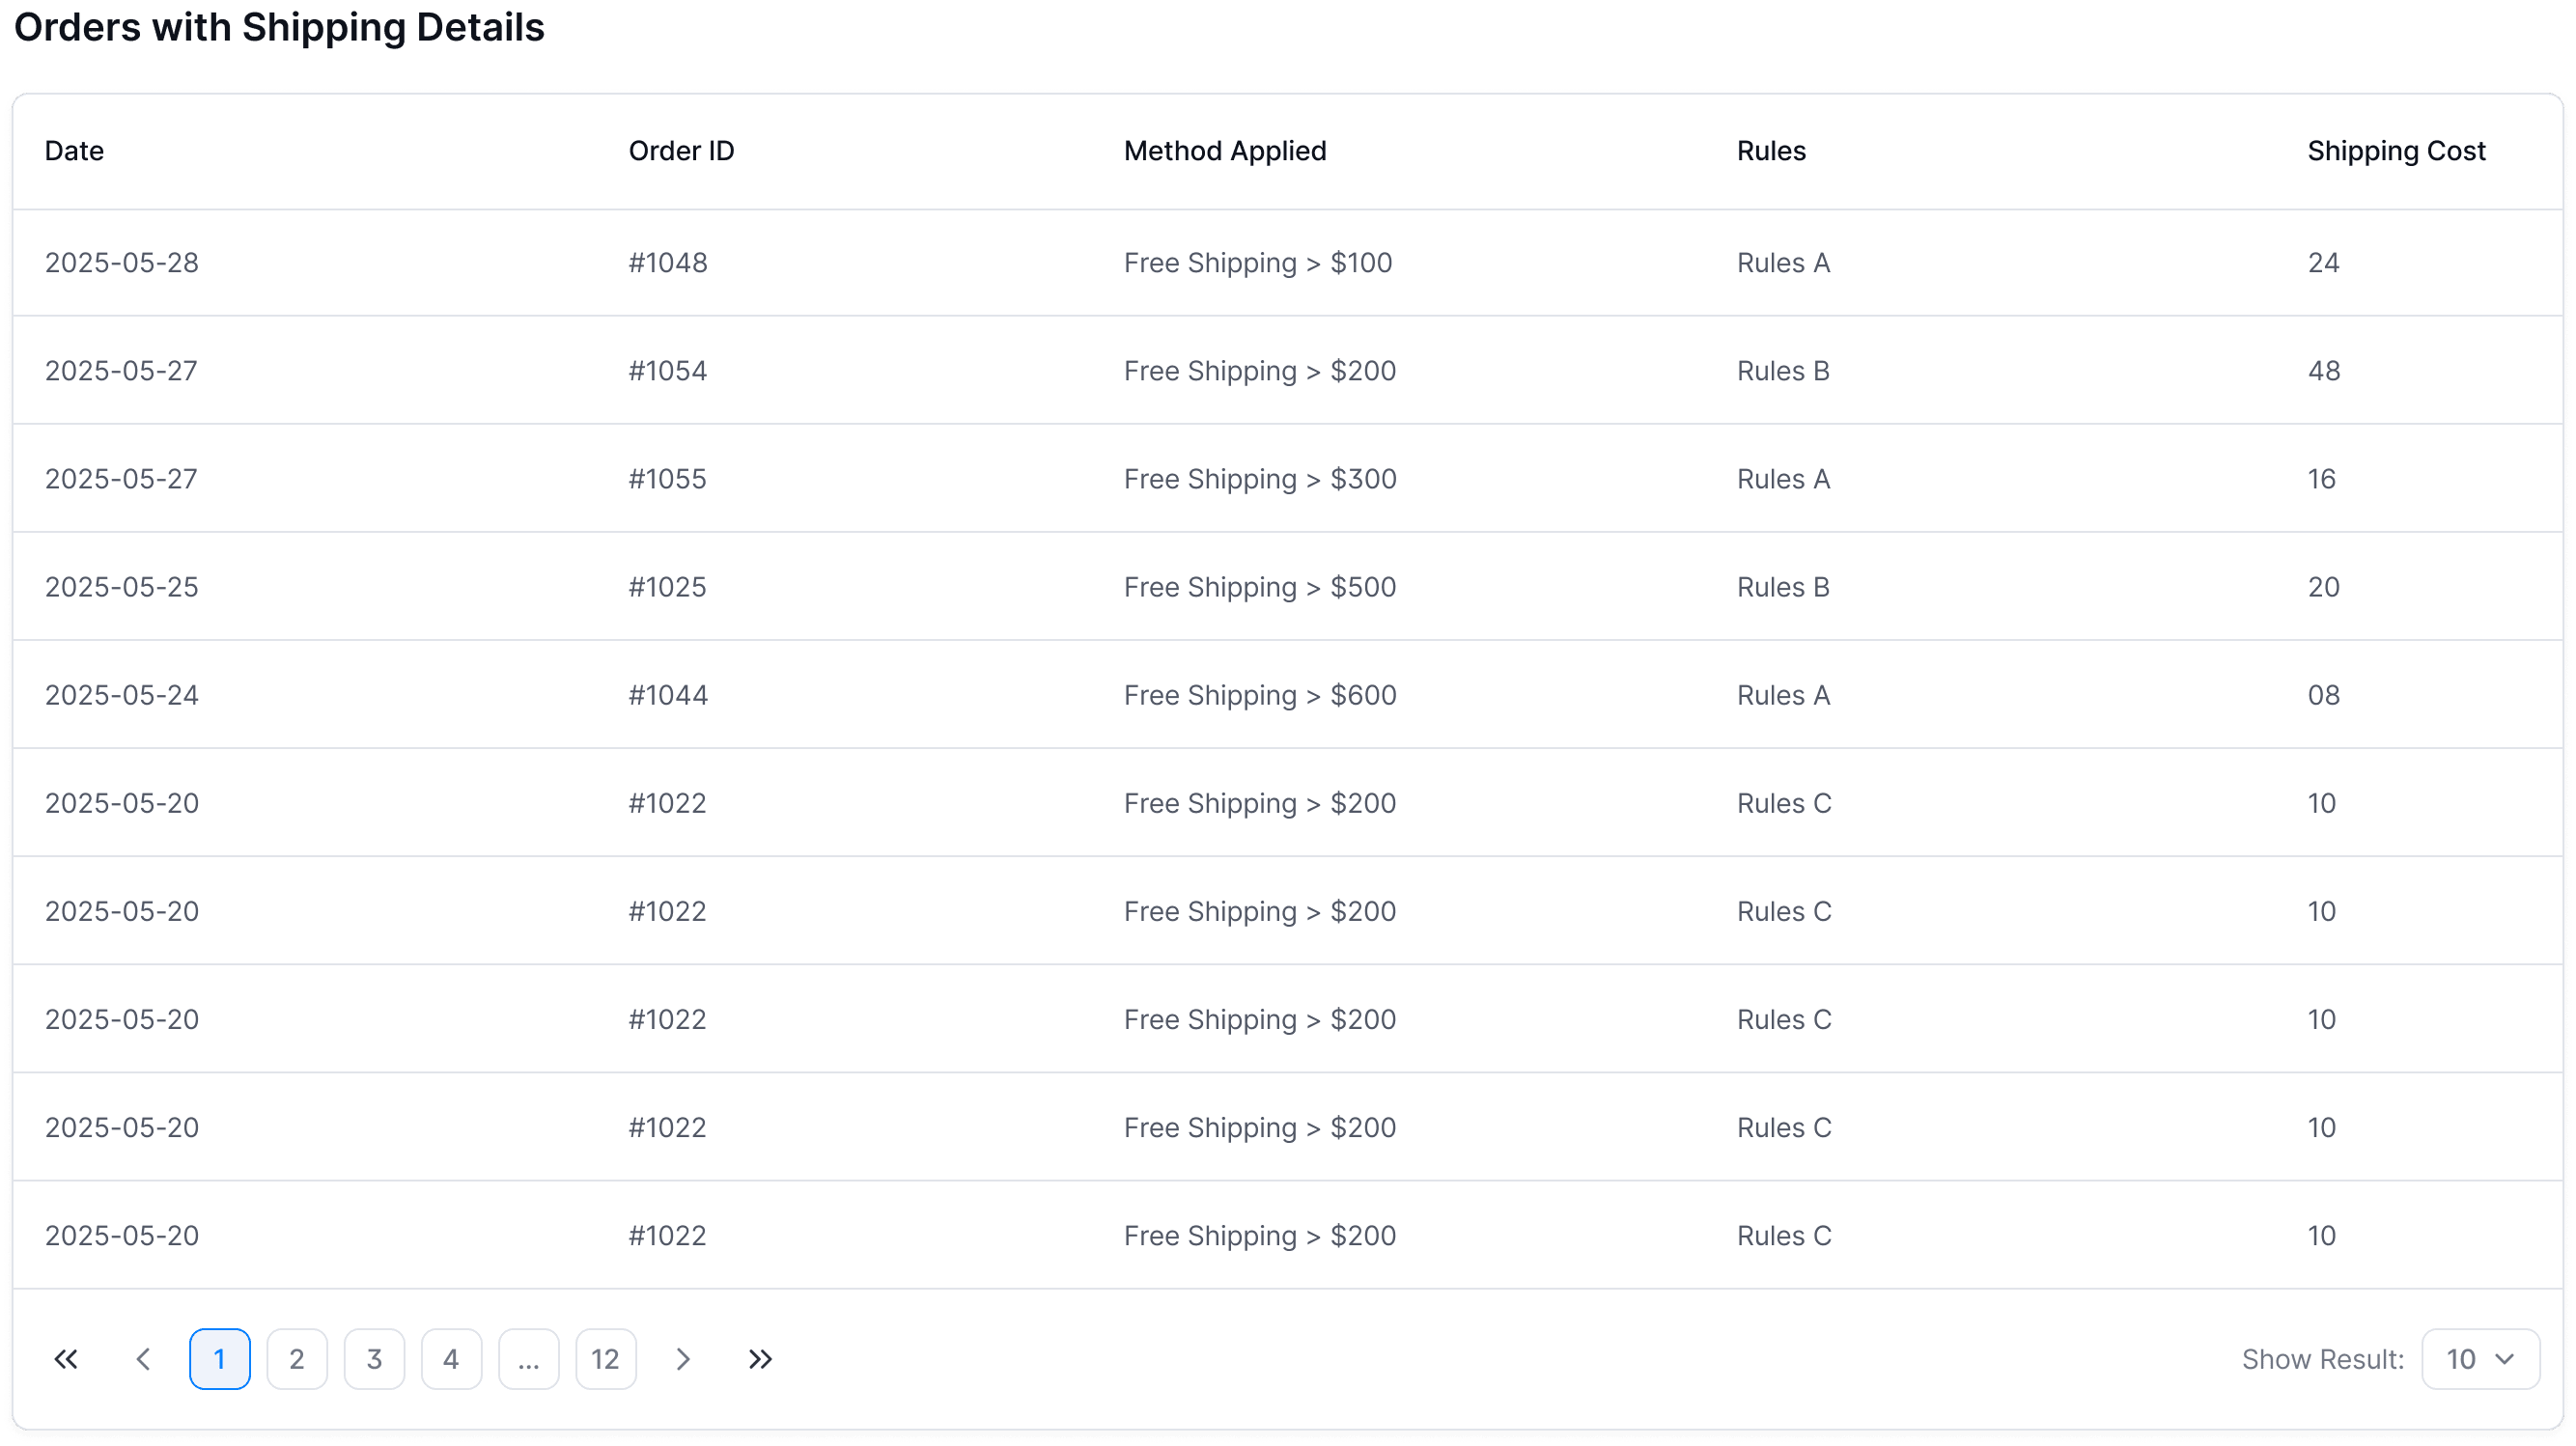
3. Orders with Shipping Details
The Orders with Shipping Details table logs each order with its shipping method. It helps you check charges, fix issues, and confirm that rules are applied correctly. Each row shows one order with its details.
| Date | Order ID | Method Name | Shipping Cost |
|---|
Each new order will appear as a row under these columns.
FAQ – Analytics & Logs
These are the common issues you may encounter:
1. Why don’t I see any spikes or variations in the graph?
- Your shipping rules may be set up as flat rates, meaning costs stay the same regardless of order details.
- If you mostly ship with free shipping, no fluctuations will be visible.
- Ensure that you’re looking at a broader range (try Last 30 Days or Last 90 Days).
2. How is the average shipping cost calculated?
- It’s the total of all shipping charges applied during the selected time period.
- Divided by the number of orders within that same period.
- Example: If you had 5 orders with a $10 shipping cost each, the average is $10.